Change Streaming
Stream updates to DynamoDB
In your web browser, open a new tab for https://console.aws.amazon.com and choose Lambda
Select Functions in the left pane
You will see the three Lambda functions that the lab deploys, named <stack name>-WiringFunction-<string>, <stack name>-LambdaFunctionForDDBStreams-<string>, and <stack name>-StreamingFunction-<string>. Click <stack name>-StreamingFunction-<string>
This function will generate random updates for the clicks and purchases fields, and send those updates to DynamoDB. These updates will in turn be shipped to Amazon ES through the LambdaFunctionForDDBStreams. If you examine the code, you’ll see that the function ignores its input and simply runs in a loop, exiting just before it times out
Click Test
Type an Event Name
Since the inputs don’t matter, you don’t have to change them. Click Create
Click Test. This will run for 5 minutes, streaming changes to Amazon ES via DynamoDB
Analyze the changes with Kibana
If you examine the code for the LambdaFunctionForDDBStreams, you’ll see that when data is modified in your DynamoDB table, the function sends both the update and a log of the changes to the clicks and purchases to a logs-<date\> index. You can use Kibana to visualize this information.
Return to your Kibana tab (or open a new one)
Click Management in the navigation pane
Click Index Patterns. You use index patterns to tell Kibana which indexes hold time-series data that you want to use for visualizations
In the Index Pattern text box, type logs (leave the ***** that Kibana adds automatically)
Kibana reports Success in identifying an index that matches that pattern
Click Next Step
Here you tell Kibana which field contains the time stamp for your records. Select @timestamp from the Time filter field name drop down
Click Create Index Pattern
Kibana recognizes the fields in your index and displays them for you
Click Discover in the navigation pane
This screen lets you view a traffic graph (the count of all events over time) as well as search your log lines for particular values
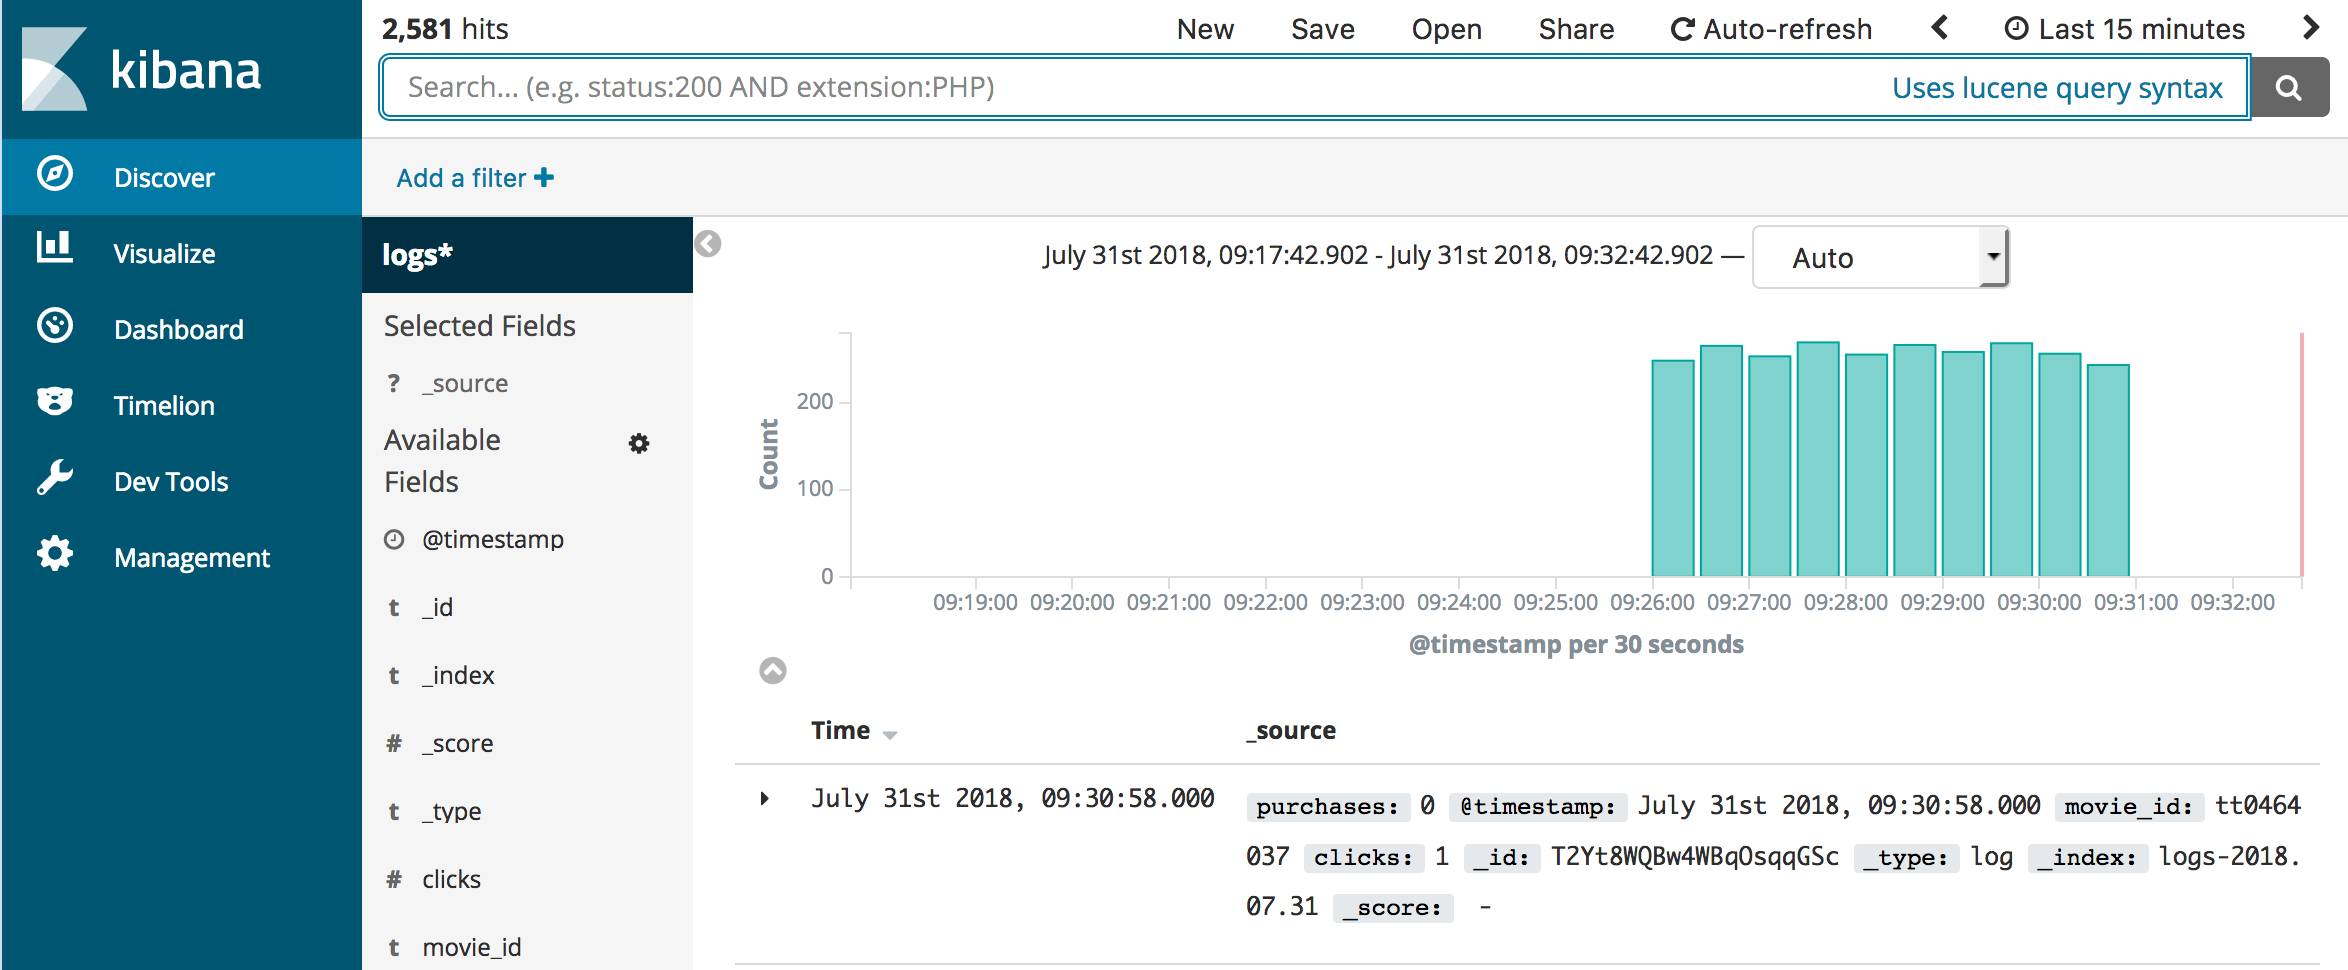
(Note, you can see my data covers 5 minutes and then stops. That’s because the Lambda function that’s streaming changes terminates. You can go back to the Lambda console and click Test again to stream more changes)
You can also use Kibana to build visualizations and gather them into a dashboard for monitoring events in near real time
Click Visualize in the navigation pane
Click Create a visualization You can see that Kibana has many different kinds of visualizations you can build
Click Line
On this screen, you tell Kibana which index pattern to use as the source for your visualization. Click logs*
When building Kibana visualizations you will commonly put time on the X-axis and a function of a numeric field on the Y-axis to graph a value over time
In the Buckets section, click X-Axis
In the Aggregation drop down, select Date Histogram
Click  to change the visualization. You now have a graph of time buckets on the X-Axis and the Count of events on the Y-Axis
In the Aggregation drop down for the Y-Axis, select Sum and in the Field drop down, select purchases to see the sum of all purchases, broken down by time
You can monitor changes in this metric, in near real time, by clicking  in Kibana’s top menu bar, and choosing 10 seconds. Kibana now updates every 10 seconds. You might have to start the Lambda stream function again to generate more data or you might see data continuing to flow in
You can save your visualizations and build them into dashboards to monitor your infrastructure in near real time.